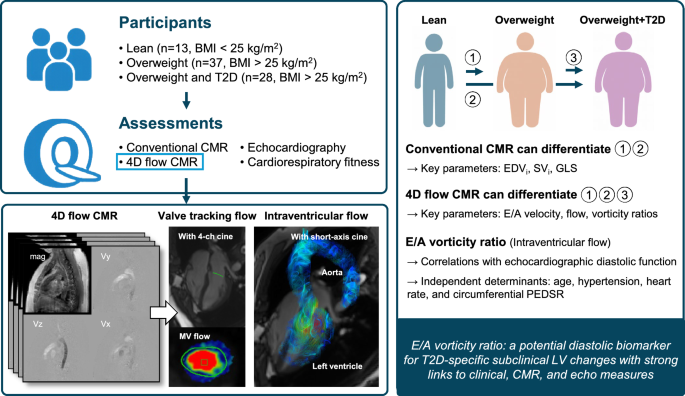
Can the way blood rotates inside the heart reveal subtle changes associated with type 2 diabetes? In our study published in Cardiovascular Diabetology, we used comprehensive cardiovascular magnetic resonance imaging (CMR), including 4D flow MRI, to investigate this question in adults with and without type 2 diabetes.
This post summarizes the study design, explains the E/A vorticity ratio, and highlights what our findings may mean for assessing early changes in left ventricular filling.
Why look at blood flow inside the heart?
The left ventricle must relax and fill between contractions. Changes in this process, known as diastolic function, may occur even when the ejection fraction remains preserved. Overweight and type 2 diabetes frequently coexist, making it difficult to distinguish their contributions to early cardiac changes.
4D flow MRI measures three-dimensional blood velocity throughout the cardiac cycle. It allows us to assess flow through the mitral valve and the rotational motion of blood within the ventricle. These measurements provide another perspective alongside conventional CMR and echocardiography.
Study overview
We evaluated 78 middle-aged adults in three groups with similar age and sex distributions. The two overweight groups also had similar BMI.
| Group | Participants | Description |
|---|---|---|
| LI | 13 | Lean individuals |
| CWO | 37 | Controls with overweight, without type 2 diabetes |
| T2D | 28 | Individuals with overweight and uncomplicated type 2 diabetes |
Assessments included conventional CMR, 4D flow MRI, echocardiography, insulin sensitivity, and cardiorespiratory fitness. This analysis used baseline measurements before exercise training. The lean reference group was recruited separately using the same imaging protocol.
What is the E/A vorticity ratio?
During diastole, the E wave represents early ventricular filling, while the A wave represents late filling caused by atrial contraction. Vorticity describes the local rotational motion of blood. In this study, we calculated vorticity from the velocity field and integrated it over the left ventricular volume at the E and A waves.
E/A vorticity ratio = E-wave integrated vorticity / A-wave integrated vorticity.
The ratio describes the relative contribution of rotational flow during these two filling phases. It differs from the conventional E/A velocity ratio, which compares peak inflow velocities. Its interpretation also depends on physiological factors such as age and heart rate.
Key findings
1. Conventional CMR identified differences associated with overweight. Indexed ventricular volumes, indexed stroke volume, and global longitudinal strain differed between lean participants and both overweight groups. These measures did not show additional significant differences between the CWO and T2D groups. Ejection fraction did not differ significantly across the three groups.
2. Several 4D flow measures distinguished the two overweight groups. E/A velocity, flow, and vorticity ratios were lower in the T2D group than in the CWO group, with pairwise P-values of 0.025, 0.031, and 0.034, respectively, after correction for multiple comparisons.
| 4D flow measure | LI | CWO | T2D |
|---|---|---|---|
| E/A velocity ratio | 1.60 (1.49–1.76) | 1.42 (1.13–1.55) | 1.10 (1.00–1.36) |
| E/A flow ratio | 1.76 (1.40–2.10) | 1.51 (1.28–1.79) | 1.18 (1.12–1.39) |
| E/A vorticity ratio | 1.33 (1.09–1.76) | 1.09 (0.91–1.27) | 0.93 (0.74–1.10) |
3. E/A vorticity was associated with established measures of diastolic function. Its association with the echocardiographic mitral E/A velocity ratio remained significant after adjustment for age and sex (Spearman’s rho = 0.35; P = 0.010). Age, hypertension, heart rate, and circumferential peak early diastolic strain rate were independently associated with the E/A vorticity ratio in the multivariable model.
What do these findings mean?
The E/A vorticity ratio is a potential imaging biomarker of subclinical diastolic alterations. Comparing overweight adults with similar BMI helped us examine differences associated with type 2 diabetes beyond those observed with overweight alone. The associations with echocardiographic and CMR measures support further investigation of its physiological relevance.
However, this was a relatively small baseline study. It does not establish a diagnostic cutoff, prove that diabetes caused the observed differences, or show that the ratio predicts future heart failure. Larger cohorts, reproducibility studies, and longitudinal assessments are needed before clinical application.
Read the full paper
Related post: Pulse Wave Velocity: Reference Values Across Diseases & Imaging Modalities.
Featured image: Figure 1, illustrating mitral inflow tracking and intraventricular flow analysis. Park et al., Cardiovascular Diabetology 25, 7 (2026). © The Author(s) 2025. Original article. Reproduced without modification under CC BY-NC-ND 4.0.