A high pulse wave velocity (PWV) tells us that an arterial pulse travels quickly. It does not, by itself, tell us why. A recent SPRINT analysis by Pewowaruk and colleagues (2026) separates the measured value into a component estimated at a common blood pressure and a component associated with the pressure load at the time of measurement. This distinction helps interpret both vascular remodeling and short-term hemodynamic effects.
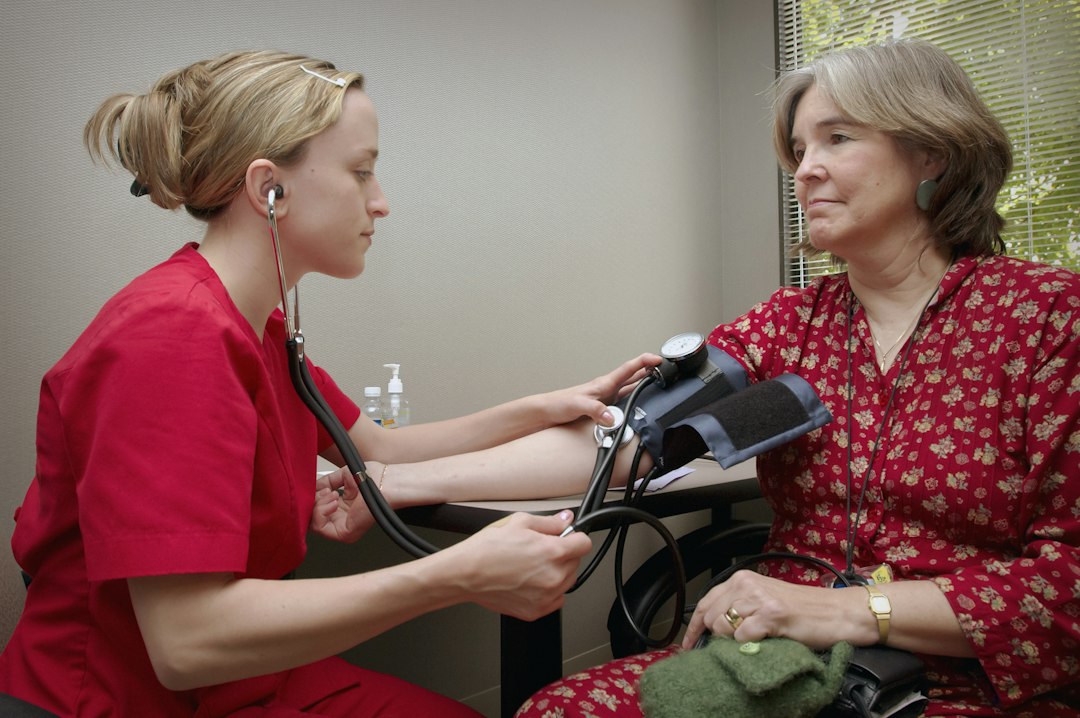
Image: CDC on Unsplash. The photograph is illustrative and is not a figure from the paper.
One PWV value, two contributors
| Term in the paper | How to read it |
|---|---|
| Total PWV (T-PWV) | The modeled cfPWV over the participant’s observed diastolic-to-systolic blood pressure range. It represents stiffness under the pressure conditions actually measured. |
| Structural PWV (S-PWV) | That participant’s model evaluated over the same 120/80 mmHg reference pressure range used for everyone. It is an isobaric estimate intended to reflect pressure-independent vessel-wall properties. |
| Load-dependent PWV (LD-PWV) | The difference T-PWV − S-PWV, expressed in m/s. It captures how much the modeled PWV changes between observed and reference pressure conditions. |
“Structural” does not mean that the investigators directly imaged collagen or measured irreversible wall remodeling. It is a model-derived estimate at standardized pressure. Likewise, load-dependent PWV is a difference in PWV, not a percentage of stiffness or a direct measure of blood pressure.
Model at the participant’s observed BP
Same person’s model at 120/80 mmHg
Total PWV minus structural PWV
How did they separate the components?
- Measure cfPWV and blood pressure. The SPRINT ancillary study measured carotid-femoral PWV with a SphygmoCor system at baseline. The analysis included 642 participants with valid measurements, follow-up, and covariates.
- Model each participant’s pressure–area relationship. The investigators used a participant-specific exponential arterial mechanics model. Measured cfPWV anchors the model, which estimates PWV over that person’s observed diastolic-to-systolic pressure range. This is the study’s total PWV.
- Evaluate the same model at a common pressure. The participant’s model is then evaluated over 120/80 mmHg, irrespective of that person’s observed pressure. This yields structural PWV at a standardized loading condition.
- Subtract. LD-PWV = T-PWV − S-PWV. If observed pressure is above the reference, the load-dependent component tends to be positive; below it, the component can be negative.
For example, 12.4 m/s total − 12.0 m/s structural = +0.4 m/s load-dependent. These values are a hypothetical example of the calculation, not an individual result from the trial.
What the subtraction cannot do: Simply subtracting a fixed correction from any cfPWV or MRI PWV measurement would not reproduce this analysis. The pressure adjustment comes from the paper’s participant-specific exponential model and its assumptions. The authors point readers to their earlier SPRINT methods paper and prior modeling work for the mathematical equations. The new article also links its analysis code.
Why does this matter?
Arterial walls become less compliant as they remodel with age and disease, but PWV also changes when blood pressure distends the wall and engages stiffer fibers. Two people with similar measured PWV could therefore have different modeled contributions. A change in total PWV after blood pressure treatment need not mean that the vessel wall itself has remodeled.
In this SPRINT secondary analysis, higher baseline LD-PWV was associated with more orthostatic hypotension events (P = 0.005 in the abstract) and more serious adverse events (P < 0.001), regardless of the randomized blood pressure treatment group. Higher total PWV was associated with serious adverse events, whereas structural PWV was not associated with these outcomes in the reported analysis. The observed associations suggest that separating the pressure-related component may reveal information obscured by total PWV alone. They do not establish a clinical cutoff or prove that reducing LD-PWV prevents adverse events.
A practical lesson for MRI-derived PWV
This study used carotid-femoral PWV, not 2D phase-contrast or 4D flow MRI PWV. Its numerical model and reference range should not be transferred directly to MRI measurements without validation. The broader lesson is methodological: record blood pressure near the PWV acquisition, report the arterial segment and PWV method, and consider whether a treatment-associated difference reflects altered pressure loading, intrinsic vessel properties, or both. Validating a pressure-standardized approach for MRI PWV would be a separate research question.
References
- Pewowaruk R, et al. Arterial Stiffness Mechanisms and Orthostatic Hypotension in SPRINT: A Randomized Controlled Trial. JACC: Advances. 2026;5:102734.
- Pewowaruk R, et al. Effects of Blood-Pressure Control on Arterial Stiffness Mechanisms in SPRINT: A Randomized Controlled Trial. Hypertension. 2025.
- Pewowaruk RJ. Simple Models of Complex Mechanics for Improved Hypertension Care. Artery Research. 2023.