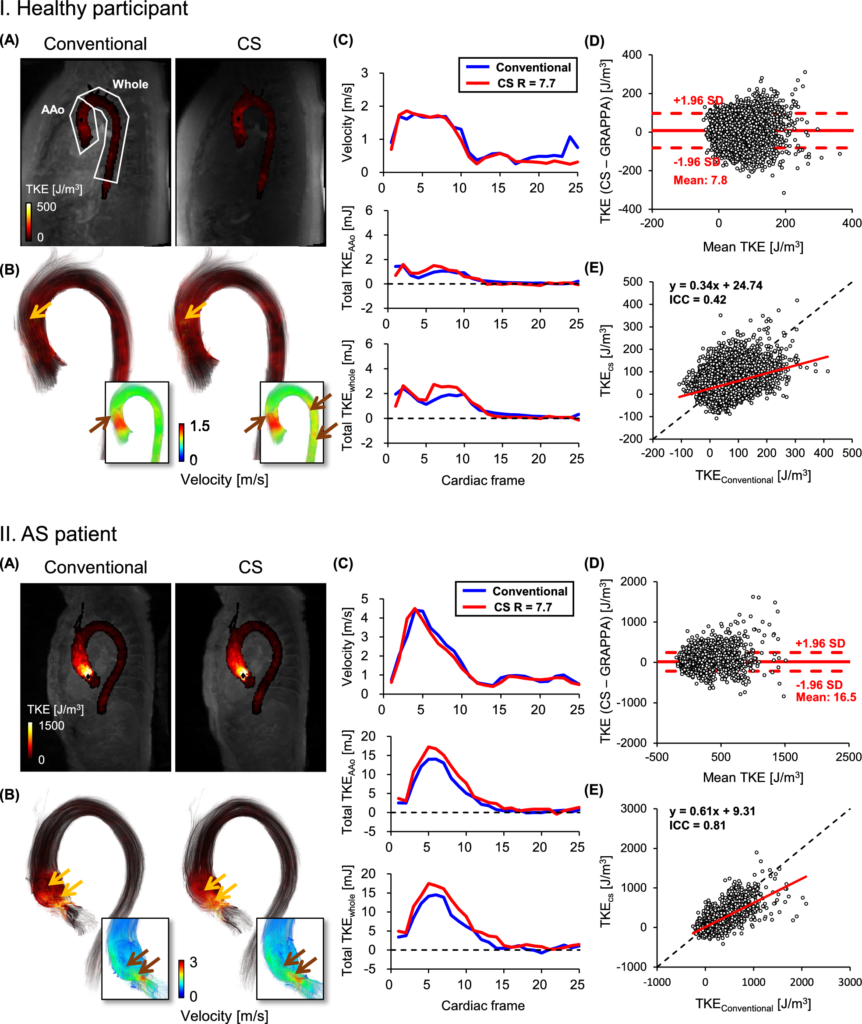
Compressed sensing shortened 4D flow MRI acquisition to approximately 2.4 minutes, while differences in turbulent kinetic energy depended on the underlying TKE level and the aortic region analyzed. Our paired comparison found relatively small average differences in ascending-aortic TKE in moderate aortic stenosis, with much larger relative differences in healthy participants.
The study was published in Scientific Reports (2026). Read the original paper ↗
Why faster imaging needs parameter-specific validation
Compressed sensing accelerates MRI through undersampling and iterative reconstruction. Shorter scans make advanced flow measurements more practical, but agreement in velocity or flow rate does not automatically establish agreement in every derived parameter.
Turbulent kinetic energy describes energy associated with unresolved velocity fluctuations within a voxel. It is distinct from kinetic energy calculated from the resolved mean velocity field. MRI-based TKE estimation uses attenuation of the magnitude signal to estimate intravoxel velocity variability, which can respond differently to reconstruction and noise.
How we compared the two acquisitions
We compared conventional GRAPPA-accelerated 4D flow MRI (R = 2) with compressed sensing (R = 7.7) in 13 healthy participants and 22 patients with moderate aortic stenosis. Both scans were obtained sequentially in the same session, with CS first and conventional imaging second. Healthy participants and patients were scanned on different 3 T systems, so the main comparison was between acquisition methods within each cohort.
VENC was set to approximately 75% of scout-derived peak velocity to improve sensitivity to intravoxel velocity fluctuations. Phase-velocity aliasing was corrected during post-processing. The same segmented aortic region was applied to the two acquisitions to support voxel-wise comparisons.
| Parameter | Healthy participants | Moderate aortic stenosis |
|---|---|---|
| Participants / age | 13 / 29 ± 5 years | 22 / 78 ± 5 years |
| Scanner | 3 T MAGNETOM Skyra | 3 T MAGNETOM Vida |
| Acceleration | GRAPPA R = 2; CS R = 7.7 | GRAPPA R = 2; CS R = 7.7 |
| Spatial resolution, as reported in Table 1 | 1.7–2.0 | 2.5 |
| Interpolated temporal resolution: GRAPPA / CS | 27.6–45.6 / 28.2–42.7 ms | 25.1–49.6 / 25.0–49.6 ms |
| Reconstructed cardiac phases | 25 | 25 |
| VENC | 70–90 cm/s | 188–300 cm/s |
| Scan time: GRAPPA / CS | 420 ± 90 / 144 ± 36 s | 390 ± 72 / 144 ± 30 s |
Table 1 labels spatial resolution in mm³ and reports a single value or range; it does not give three separate voxel dimensions in that row. The temporal values above are explicitly interpolated resolution.
How turbulent kinetic energy was measured
Intravoxel velocity standard deviations were estimated from reference and velocity-encoded magnitude signals. TKE density was then calculated from the three directional velocity variances and blood density. Integrating this density over the segmented region gave total TKE. Measurements were evaluated separately in the ascending aorta and the whole aortic region.
We assessed peak total TKE over the cardiac cycle (TKEmax) and the sum of total TKE values across systolic frames (TKEsys). The latter is a frame-summed measure as defined in the paper, rather than a continuous time integral. Paired tests and Bland–Altman analysis compared acquisitions; tests across cardiac frames used Benjamini–Hochberg correction. An in vitro coarctation phantom also explored differences in jet and non-jet regions.
Key results
| Cohort / region | GRAPPA, mean ± SD | CS, mean ± SD | Mean individual change with CS | Paired P |
|---|---|---|---|---|
| Healthy / ascending aorta | 0.74 ± 0.43 mJ | 1.17 ± 0.72 mJ | +95.4% | 0.053 |
| Healthy / whole aorta | 1.13 ± 0.73 mJ | 2.13 ± 0.95 mJ | +207.7% | 0.006 |
| Aortic stenosis / ascending aorta | 14.0 ± 4.6 mJ | 14.8 ± 5.5 mJ | +5.0% | 0.129 |
| Aortic stenosis / whole aorta | 16.3 ± 5.5 mJ | 17.6 ± 6.5 mJ | +7.4% | 0.050 |
Percentage changes are means of participant-specific relative differences, calculated as (CS − GRAPPA) / GRAPPA. They therefore differ from a percentage calculated directly from the two group means.
In aortic stenosis, ascending-aortic TKEmax had a small average difference without a statistically significant paired difference. This supports feasibility under the tested protocol; a non-significant test does not, by itself, prove equivalence or interchangeability. Whole-aorta systolic frame-summed TKE increased by 10.9% (P = 0.017), showing why the choice of region matters.
In healthy participants, small absolute changes in a low-TKE setting translated into large percentage differences. Larger relative differences in non-jet regions of the phantom supported this low-TKE interpretation. The findings do not imply that compressed sensing caused a physiological increase in turbulence.
Practical implications and next steps
The promising result is the combination of shorter acquisition and relatively small ascending-aortic TKE differences in moderate aortic stenosis. The main caution is that acceleration performance depends on the parameter, region, and underlying signal level. Low-TKE and whole-aorta measurements need their own validation.
Only one CS acceleration setting was tested. Acquisition order was fixed, and the cohorts differed in age, scanner, and sequence parameters. Broader validation should examine acceleration, regularization, VENC, reproducibility, and a wider range of disease severity. These results should be read as paired protocol comparisons, rather than a standardized healthy-versus-disease reference dataset.
Primary source
Park S, Yi J-E, Jin N, et al. Comparison of compressed sensing and conventional 4D flow MRI for turbulent kinetic energy assessment in healthy participants and patients with aortic stenosis. Scientific Reports. 2026;16:26434. DOI: 10.1038/s41598-026-55843-9. Sungho Park and Jeong-Eun Yi contributed equally.
Keywords: compressed sensing, 4D flow MRI, turbulent kinetic energy, aortic stenosis, ascending aorta, GRAPPA, accelerated cardiac MRI.