A narrow valve changes the route blood takes through the aorta. Could the resulting flow pattern add information to routine assessment? Our exploratory study approached moderate aortic stenosis (AS) through the three-dimensional organization of blood flow.
Following patients from a baseline scan
Fifteen patients underwent baseline 4D flow MRI and echocardiography, with repeat echocardiography within two years. The study compared baseline flow measurements according to whether patients subsequently underwent aortic valve replacement (AVR).
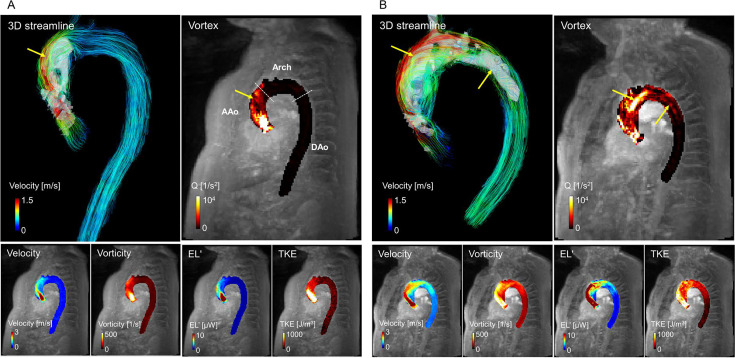
A vortex is more than a colorful streamline
Vortex volume describes the space occupied by rotational flow structures identified using the Q-criterion. Its value depends on the threshold used to retain stronger structures and exclude weaker ones. The analysis therefore examined threshold sensitivity.
What the study found
Baseline peak vortex volume was higher in the group that later underwent AVR (P = 0.009). The reported discrimination was an AUC of 0.88. Vortex volume was also associated with echocardiographic measures of stenosis severity.
A promising observation, with an important boundary
This small study supports further investigation, not a validated rule for deciding when to replace a valve. Associations with a subsequent intervention do not establish independent prediction or prove that vortices cause disease progression.
Two complementary research questions
One question asks whether a flow measurement can be obtained consistently. Another asks whether it adds useful information for patients. Keeping those questions separate makes imaging research easier to interpret.
For the acquisition side, read our comparison of compressed sensing and conventional 4D flow MRI for TKE. Explore more studies in the 4D flow MRI research hub.
How to read the flow image
Figure 1 presents two individual examples, not the full distribution of results. The streamlines help show how blood moves through the vessel, while the vortex display highlights structures selected by the Q-criterion. A striking image is useful for explaining a measurement, but the group comparison is what supports the reported association.
For interpreting this study, an important next question is whether vortex volume adds information beyond the echocardiographic measures already used to assess AS. That requires testing in larger, independent cohorts. The current findings are best read as a reason to investigate the marker further.
A related example is our portal vein vorticity study. It examines another vascular setting, illustrating why a flow marker needs validation for the specific clinical question being asked.
Why the vortex threshold belongs in the result
A vortex volume is not simply a count of every region where blood appears to turn. The Q-criterion selects rotational structures according to a numerical threshold. Lowering that threshold includes weaker structures and increases the volume; raising it retains stronger structures and reduces the volume. The paper’s threshold analysis shows why this processing choice matters when comparing the AVR and no-AVR groups.
For future replication, the threshold, anatomical region, and cardiac phase should be reported alongside vortex volume. Otherwise, two studies could use the same measurement name while quantifying different structures.
Original paper
Park S, Yi JE, Kim SH, et al. Abnormal vortex formation by 4D flow MRI as a marker for aortic valve replacement in moderate aortic stenosis: an exploratory study. Open Heart. 2025;12:e003787. Read the paper.
Keywords: aortic stenosis, 4D flow MRI, aortic vortex volume, Q-criterion, aortic valve replacement, cardiovascular hemodynamics.