How much blood leaves the heart is only part of the story. Where does that blood go? A regional view of circulation asks a different question from a single measurement of cardiac output.
Measuring circulation beyond the heart
Our study compared 17 participants with Fontan circulation and 14 biventricular controls. MRI quantified regional arterial flow, while hemoglobin and pulse oximetry were used to estimate oxygen content and calculate oxygen delivery.
The approach combined 2D phase-contrast measurements with abdominal 4D flow MRI. Some abdominal branch flows were derived by subtracting aortic flow measurements rather than measuring every small branch directly.
A regional pattern
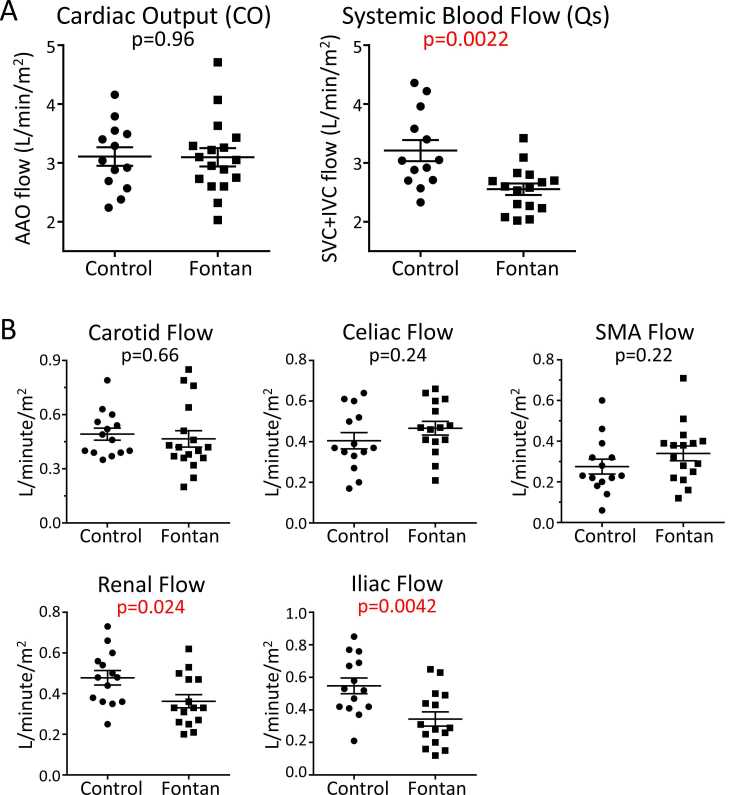
Renal and iliac arterial flows were lower in the Fontan group. Carotid, celiac, and superior mesenteric flows were preserved. Oxygen content was similar between groups, so oxygen-delivery differences followed the flow pattern.
Why cardiac output alone missed part of the picture
Cardiac output did not differ between groups, but systemic blood flow was lower in Fontan participants because of aortopulmonary collateral flow. Lower systemic flow was associated with lower iliac flow.
What happens during exercise remains a question
These MRI measurements were collected supine and at rest. They do not show how regional flow redistributes during exercise or establish a causal explanation for organ disease.
Reading the circulation as a distribution problem
A useful way to read this work is to ask three questions: what was measured, which pathway was sampled, and under what conditions? That approach also helps when comparing results across imaging studies.
Explore the 4D flow MRI research hub or our fetal circulation visualization for another example of following blood along different pathways.
Reading Figure 2: amount versus destination
The top panels distinguish cardiac output from systemic blood flow. The lower panels then show the regional distribution: renal and iliac flow differed between groups, whereas the other measured arterial territories did not show significant group differences. This is why summarizing the result as simply “less blood flow everywhere” would miss the study’s central observation.
The error bars represent standard errors, not the spread of all individual values. The plotted points therefore matter: they make the overlap between participants visible and help keep a group-level finding from becoming an assumption about every person with Fontan circulation.
For a separate example of studying congenital circulation through flow measurements, read our pulmonary flow restrictor bench study. It concerns device testing in a different setting, rather than evidence for a Fontan treatment.
From flow to oxygen delivery
Oxygen delivery combines two quantities: the volume of blood reaching a territory and the oxygen carried in that blood. In this study, estimated oxygen content was similar between groups, so the regional delivery pattern largely reflected the differences in flow. This distinction helps explain why measuring oxygen saturation alone would not capture the whole result.
Some abdominal branch flows were calculated from differences between measurements above and below branch origins. Interpreting those estimates requires attention to both contributing measurements. They should not be confused with direct measurements of oxygen extraction or tissue metabolism, which were not the endpoints described here.
Original paper
Romanowicz J, Park S, Bunn J, et al. Magnetic resonance quantification of regional blood flow and oxygen delivery to the brain, gut, kidneys, and lower extremities in adolescents with a Fontan circulation compared to biventricular controls. J Cardiovasc Magn Reson. 2025;27:101907. Read the paper.
Keywords: Fontan circulation, regional blood flow, oxygen delivery, 4D flow MRI, 2D phase-contrast MRI, congenital heart disease.