What changes between the acute injury and the remodeled heart? In this exploratory study, we followed two pigs through 10 cardiac MRI sessions per animal, from pre-infarction baseline to 11 weeks after myocardial infarction (MI). The main contribution was the closely spaced longitudinal sampling: tissue characteristics, ventricular structure, function, and intracardiac flow could be examined along each animal’s individual trajectory.
Why closely spaced follow-up matters
A comparison between an early scan and a late scan can describe the endpoints, but miss the fluctuations between them. We acquired MRI before MI, immediately afterward, at 72 hours, and at 1, 2, 3, 4, 5, 7, and 11 weeks. Closely spaced MRI follow-up allowed us to observe changes and fluctuations throughout the 11-week remodeling period.
MI was induced by one-hour balloon occlusion of the left anterior descending artery followed by reperfusion. Serial imaging combined cine MRI, late gadolinium enhancement (LGE), native T1 mapping, extracellular volume, strain, and 4D flow MRI. T2 mapping was available for pig 1 only. One 4D flow dataset, pig 1 at week 3, was excluded because of poor image quality.
What 4D flow MRI added
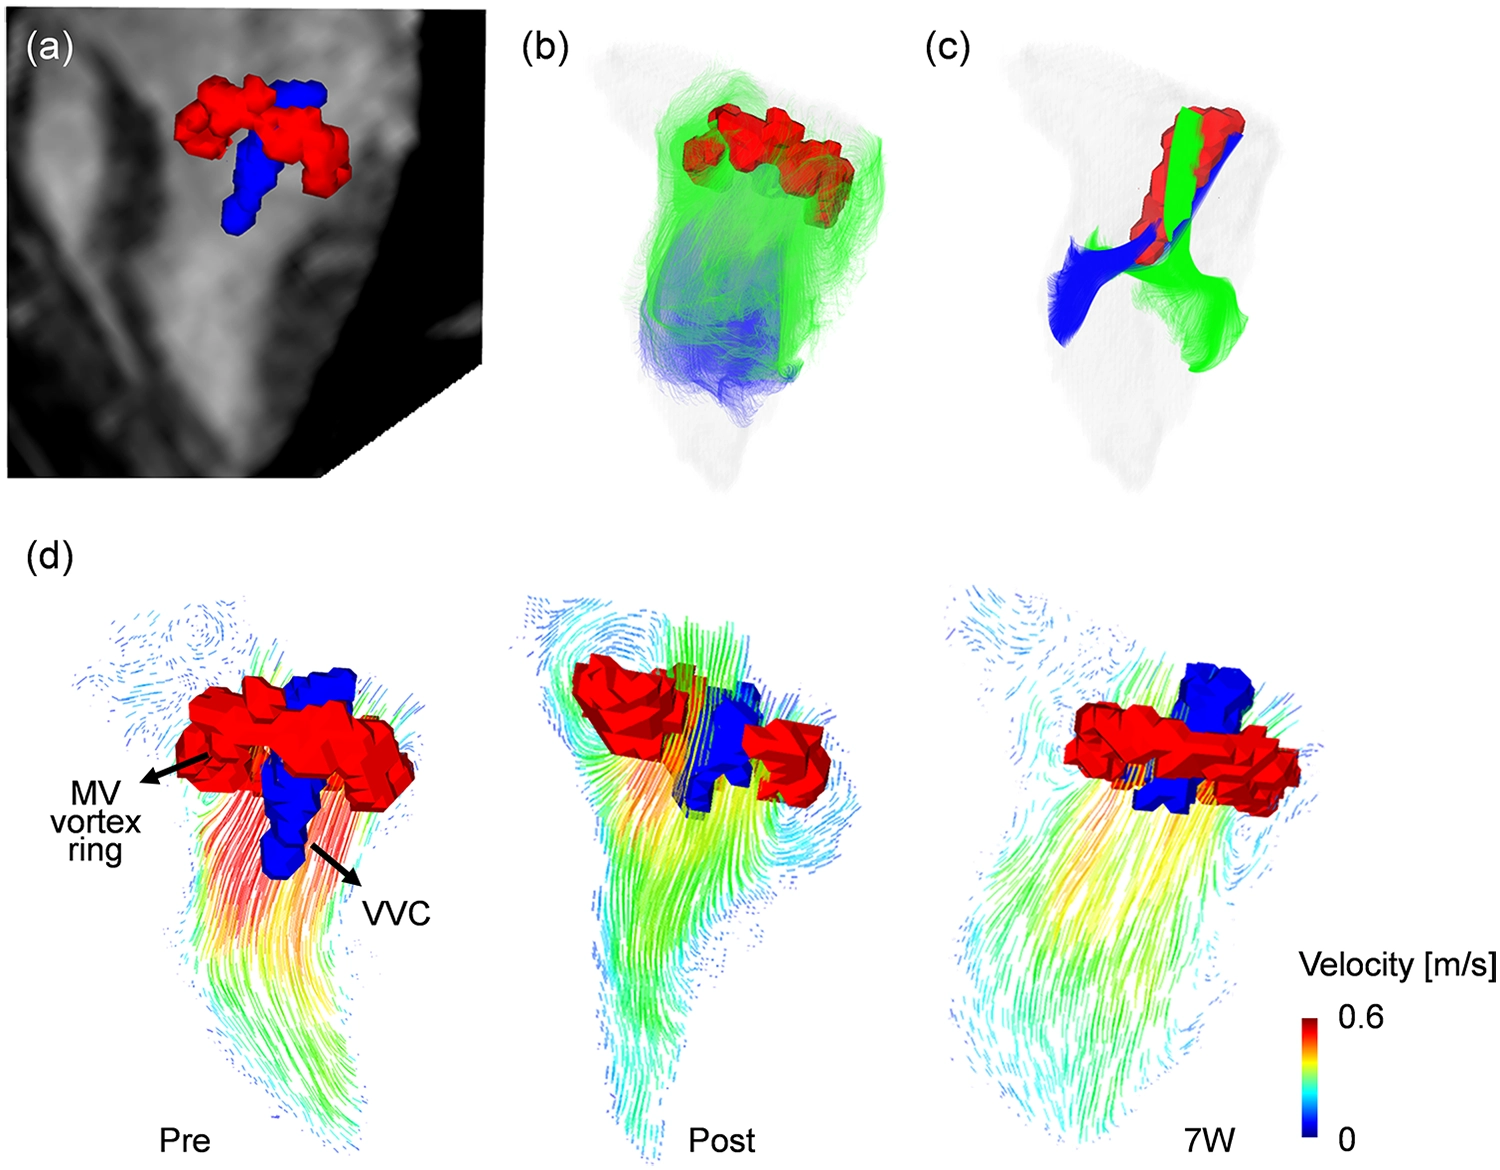
We examined both how much local rotation was present and how the filling flow was oriented. These describe different aspects of intracardiac flow.
| Measure | What it describes |
|---|---|
| E/A flow ratio | The relative early and late diastolic filling peaks derived from flow rates at the basal plane. |
| Regional vorticity | Local rotation calculated from the curl of the velocity field, assessed at basal, mid, and apical planes. |
| Vortex structures | Rotational structures identified using the Lambda2 method, including the mitral valve vortex ring and vertical vortex core (VVC). |
| VVC angle | The angle between the anatomical LV centerline and the centerline of the helical filling vortex. |
The VVC analysis focused on early diastole when the structure was clearly visible. When it was not identifiable at the E-wave, a later diastolic phase was used. This is relevant when interpreting comparisons across visits.
What we observed
Both animals showed remodeling patterns that included thinning of the infarcted wall and increasing indexed ventricular volumes. Tissue measurements also varied across follow-up. LGE extent generally declined but showed secondary increases at individual visits, illustrating why a trajectory can be more informative than two endpoints. A decrease in LGE extent alone should not be read as proof of tissue recovery.
Regional vorticity showed no clear overall temporal tendency, while the filling-vortex angle tended to increase in both animals. The angle changed from 10.6° at baseline to 21.8° at week 11 in pig 1, and from 13.3° to 27.3° in pig 2. Intermediate values fluctuated, so this was not a steady increase at every visit.
We summarized temporal trends separately for each animal using Theil–Sen slopes and residual-bootstrap confidence intervals with 1,000 resamples. For the angle, the reported slopes were 0.6 (95% CI −0.1 to 1.4) and 0.8 (95% CI 0.0 to 1.8). These estimates describe exploratory trajectories; they do not establish a population-level effect.
How to interpret this small study
The interesting observation is that relatively preserved vorticity can coexist with changes in flow organization. Looking at rotational magnitude alone may therefore miss changes in filling direction. Whether this reorientation reflects compensation, altered geometry, or another mechanism remains an open question.
Two animals, even with many scans, remain two biological subjects. The study had no non-MI control animals or histological validation, and baseline flow patterns differed between the pigs. Segmentation, spatial resolution, and the cardiac phase selected for vortex analysis also affect interpretation. The porcine helical filling pattern may not translate directly to human LV flow.
The study provides a detailed longitudinal example and a question for larger studies: can changes in filling-flow orientation help characterize remodeling when vorticity magnitude changes little? It does not yet establish a diagnostic threshold or a validated prognostic biomarker.
4D flow MRI acquisition
| Scanner | 3-T Siemens Skyra |
|---|---|
| Voxel size | 2.0 × 2.0 × 2.0 mm³ |
| Cardiac phases | 25 per cardiac cycle |
| VENC | 150 cm/s |
| TE / reported TR | 2.69 ms / 41.92 and 62.88 ms |
| Gating | Retrospective ECG gating with respiratory motion compensation |
Related reading: 4D flow MRI and diastolic vorticity in type 2 diabetes, and E/A reference values in healthy volunteers.
Original paper
Park S, Ahn Y, Kwon M, Koo HJ, Yang DH, Huh H. Longitudinal observation of left ventricular inflow reorientation with preserved vorticity after myocardial infarction in a porcine model. Frontiers in Cardiovascular Medicine. 2026;13:1742432. Read the open-access paper.
Keywords: 4D flow MRI, myocardial infarction, left ventricular remodeling, porcine model, longitudinal cardiac MRI, diastolic filling, vorticity, vortex orientation, helical flow.